


The 1904 St. Louis Olympic Marathon, though almost lost in history, was one of the most controversial marathons in world history. It featured only 32 people, of whom 14 managed to cross the finish line.
Of the 14, one person dropped out after nine miles due to cramps, hitched a ride in a car for 11 miles, and jogged the remaining distance; another was chased a mile off course by a pack of wild dogs; a third suffered stomach cramps from eating rotten apples; and our main protagonist and eventual winner, Thomas Hicks, only crossed the finish line after being injected with strychnine.
By the 19-mile mark, Hicks was finished. His legs were dead, and his mind was drifting. He pleaded with his trainers to let him lie down. Instead, they reached into their bags for the “doop.” (This was one of the earliest mentions of doping in humans)
In the final miles, Hicks was no longer fully conscious of his surroundings. He began hallucinating that he still had 20 miles to go. He was essentially carried across the finish line by his handlers, and his feet continued to move mechanically in the air even as they held him up.
How is this significant to the stock market? After buying oil for more than $5 a gallon, receiving alerts of layoffs almost every week, and commercial bankruptcies in Q1 2026 increasing by 14% YoY, the S&P being at all-time highs feels a bit like Thomas Hicks on PEDs.
Commercial Bankrupcy Acceleration
Q1 2026 Filings
YoY Growth
Subchapter V
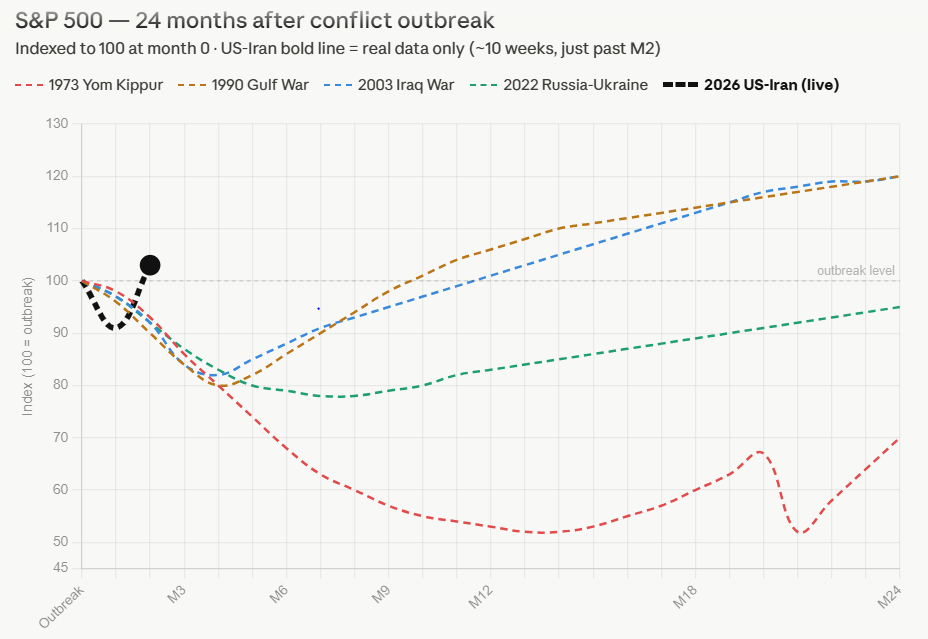
Peace is the New Global Currency
It is nearly impossible to have a conversation lately without referencing the US-Iran conflict. Since March 23, there have been at least six official announcements about peace and the end of the war, and the market has responded in one of the steepest V-shaped recoveries ever recorded.
Zooming out, the “war” barely registered as a correction. The S&P dropped about 8% before peace became the new ‘global currency’, and the index has since crossed the $7,000 mark with huge momentum.
S&P 500 vs. Crude Oil (WTI)
Market Resilience vs. Energy Volatility (2025–2026)
Pause and Selah on this.
We saw the capture of the president of a major oil producer, the death of a supreme leader of another oil-producing nation, oil prices rallying like a meme stock, and a game of chess over the Strait of Hormuz. Yet the S&P is just like ‘Yeah bro, these are fuel to go higher.’
The speed of this bounce is unprecedented. Contrast this with the Russia-Ukraine war: according to S&P historical data, it took the market over six months to climb from its absolute bottom back to pre-war levels. This current recovery took only 11 days.
I’m in no way insinuating that the Russia-Ukraine war is the standard for market recovery, but if we go back to the last four wars involving oil producers, it is clear the pain trade is lower.
Will I short the market now? No. There’s a reason why PEDs are banned in sports. I would not be so foolish to bet against a market that is on PEDs. However, I’m not oblivious to what is fueling this market.
The AI Rally
The AI rally that started in 2022 has defied every traditional “bubble” warning. Critics who predicted a swift burst were silenced as Nvidia surged over 1,300% in just four years. For a long time, the growth felt supported by a genuine shift in global infrastructure.
My stance since 2024 has been that we hadn’t yet reached the peak. But the events of the last few days have changed my conviction: we have officially entered bubble territory.
While we cannot time the market and history rarely repeats itself verbatim, I always tell my students one thing: Trust your gut.
Do I think the market feels almost like the 1999/2000 era? I really can’t say (I was too young to care about the market then.) Do I think we keep going up? Well, like Thomas Hicks in our earlier story, I think we are nearing the finish line, and the current atmosphere carries a distinct scent of late-stage mania.
The $650 Billion Gamble
Amazon, Microsoft, Meta, and Google together plan to spend roughly $650 billion in 2026, a 60% increase over their combined 2025 spend of around $400 billion. Put side by side, this dwarfs even the 1990s telecom boom.
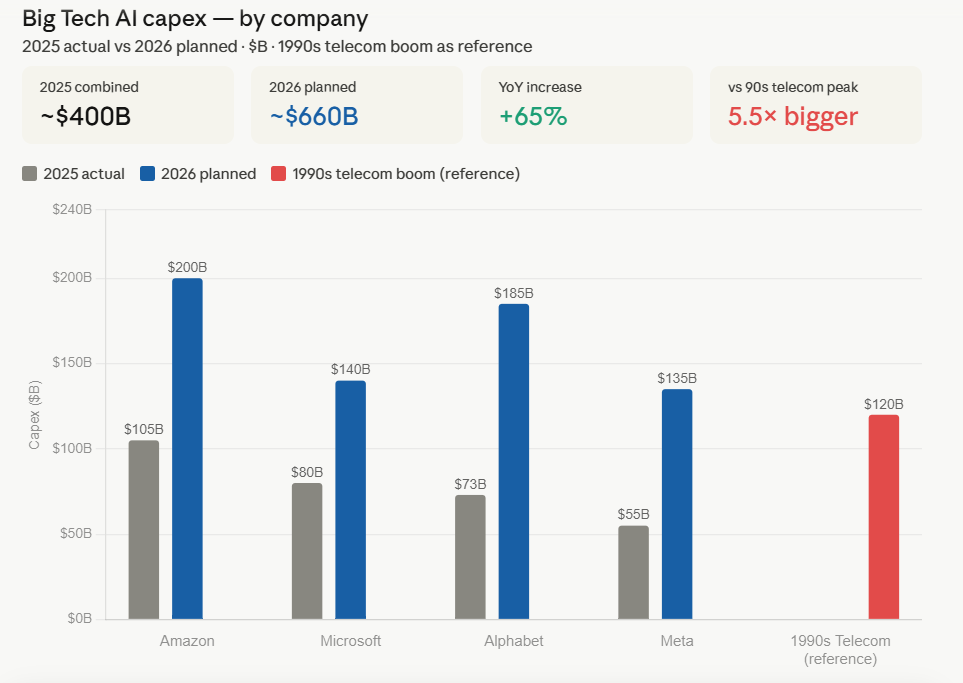
Nvidia’s data center business generated a record $197 billion in revenue in its last fiscal year. So we can really say the demand is there, and the big guns are moving hard to capture it.
What is worth noting, however, is the circular dependency at play: Nvidia derives almost 60% of revenue from six customers, with the top four accounting for nearly 46% of sales. Nvidia’s revenue is not broadly distributed demand, it is concentrated demand from a handful of hyperscalers. If those four companies revise their capex plans, Nvidia’s earnings story – and that of the entire market – changes quickly.
The Architects of Nvidia’s $130B Year
Identifying the Top 6 Revenue Sources (FY 2025)
6 Companies drive 55% of Nvidia’s total revenue (~$71.7 Billion)
Microsoft (Customer A)
The largest single H100 consumer.
Meta (Customer B)
Building the Llama compute clusters.
Amazon / AWS
Scaling Bedrock & Cloud AI services.
Alphabet (Google)
GCP scaling alongside TPU efforts.
Oracle / CoreWeave
Specialized AI cloud providers.
Super Micro / Dell
Key integrators for Enterprise AI.